R的极客理想系列文章,涵盖了R的思想,使用,工具,创新等的一系列要点,以我个人的学习和体验去诠释R的强大。
R语言作为统计学一门语言,一直在小众领域闪耀着光芒。直到大数据的爆发,R语言变成了一门炙手可热的数据分析的利器。随着越来越多的工程背景的人的加入,R语言的社区在迅速扩大成长。现在已不仅仅是统 计领域,教育,银行,电商,互联网….都在使用R语言。
要成为有理想的极客,我们不能停留在语法上,要掌握牢固的数学,概率,统计知识,同时还要有创新精神,把R语言发挥到各个领域。让我们一起动起来吧,开始R的极客理想。
关于作者:
- 张丹, 分析师/程序员/Quant: R,Java,Nodejs
- blog: http://blog.fens.me
- email: bsspirit@gmail.com
转载请注明出处:
http://blog.fens.me/r-coivd19-data-nCov2019

前言
新冠长期以来影响着我们的工作和生活,近期在北京和上海两个超大城市,还在不停的变种和传播,居家办公,每天核酸,都已经变成了生活的常态。
对新冠数据进行数据分析,就需要获取新冠的数据。中国的团队开发的R包nCov2019,可以方便的获得新冠全量数据,帮助我们提高数据获取的效率。
目录
- 开源新冠疫情数据包 nCov2019
- 安装nCov2019包
- 查看数据集
- 疫情可视化:世界地图
- 疫情可视化:多种分析图表
- 疫情可视化:shiny控制台
1. 获取新冠疫情数据
当前有很多的新冠疫情开源的数据源,为了简化数据获取难度、并分析方便,我找到一个R语言新冠数据开源项目 YuLab-SMU/nCov2019。nCov2019包,收集了从全球新冠疫情的数据,从2020年01月22日开始到当前的每日新冠的数据,支持R语言的API的,我们直接使用这个包就可以获得全球数据,并在github上的开源。
nCov2019项目,为了方便获取有关冠状病毒爆发的流行病学数据,除了详细的基础统计数据外,它还包括有关疫苗开发和候选疗法的信息。 并设计了用于地理地图可视化的函数 plot() 并提供了一个交互式shiny应用程序。 这些功能有助于告知公众和研究这种病毒和类似病毒如何在人口稠密的国家传播。
nCov2019项目,是由中国的南方医科大学基础医学院生物信息学系研发,研发团队:https://yulab-smu.top/members/。给中国的团伙点 “赞”。
2.安装nCov2019包
首先,安装nCov2019包,如果一切顺利,一条命令就完成了。
# 如果没有remotes包,请先安装remotes包,这样才能从github上下载代码。
# > install.packages("remotes")

# 安装YuLab-SMU/nCov2019包
> remotes::install_github("YuLab-SMU/nCov2019")
Using github PAT from envvar GITHUB_PAT
Downloading GitHub repo YuLab-SMU/nCov2019@HEAD
小插曲:如果在安装时,出现 GITHUB_PAT错误时。
Using github PAT from envvar GITHUB_PAT
Error: Failed to install 'unknown package' from GitHub:
  HTTP error 401.
  Bad credentials

  Rate limit remaining: 27/60
  Rate limit reset at: 2021-09-30 19:17:49 UTC
说明你的GITHUB没有设置 开通Personal access tokens的权限,请访问打开https://github.com/settings/tokens 点击 generate new taken 按钮,创建一个新的token,复制这个新生成的token。之后,切回到R语言开发环境,使用R语言命令,会打开一个新文件,并输入新生新的token。
> usethis::edit_r_environ()
* Modify 'C:/Users/bsspi/Documents/.Renviron'
* Restart R for changes to take effect
文件内容:请替换自己的token。
GITHUB_PAT=ghp_a4e7l0KjhVVzX5J86PjVcFS7A7u8st1rvQIN设置完GITHUB_PAT后,保存再重启R语言环境,再执行安装命令就可以正常下载和安装了。
> remotes::install_github("YuLab-SMU/nCov2019")加载nCov2019包,再加载数据
> library(nCov2019)
> x <- query()
Querying the latest data...
last update: 2022-07-05
Querying the global data...
Gloabl total  555324897  cases; and  6362663  deaths
Gloabl total affect country or areas: 230
Gloabl total recovered cases: 165929
last update: 2022-07-05
Querying the historical data...
Querying the vaccine data...
Total Candidates Programs : 51
Querying the therapeutics data...
Total Candidates Programs : 84
Query finish, each time you can launch query() to reflash the data

#查看x对象
> x
$latest
last update: 2022-07-05

$global
$updated
[1] "2022-07-05"

$cases
[1] 555324897

$todayCases
[1] 137897

$deaths
[1] 6362663

$todayDeaths
[1] 261

$recovered
[1] 530092910

$todayRecovered
[1] 165929

$active
[1] 18869324

$critical
[1] 38501

$casesPerOneMillion
[1] 71243

$deathsPerOneMillion
[1] 816.3

$tests
[1] 6480187084

$testsPerOneMillion
[1] 816521

$population
[1] 7936338827

$oneCasePerPeople
[1] 0

$oneDeathPerPeople
[1] 0

$oneTestPerPeople
[1] 0

$activePerOneMillion
[1] 2377.59

$recoveredPerOneMillion
[1] 66793.13

$criticalPerOneMillion
[1] 4.85

$affectedCountries
[1] 230

attr(,"class")
[1] "global_summary"
attr(,"row.names")
[1] 1

$historical
last update: 2022-07-04

$vaccine
Total Candidates Programs : 51

$therapeutics
Total Candidates Programs : 84
由下载数据比较慢,所以我们可以下载完成后,先在本地存一份
# 设置工作路径
> setwd("C:/work/R/covid19")

# 本地存储
# > saveRDS(x,"x.rds")

# 本地读取
# > x<-readRDS("x.rds")
3. 查看数据集
查看 x 对象变量,x对象是一个list类型,包括了全部的新冠数据集,按使用方便主要分另5个数据集进行存储。我们可以用names()函数,找到这5个数据集。
> names(x)
[1] "latest"       "global"       "historical"   "vaccine"      "therapeutics"
- global,全球总体汇总统计
- latest,全球所有国家的最新一天数据
- historical,全球所有国家的历史数据
- vaccine,目前疫苗研发进展
- therapeutics,目前的治疗学发展进展
3.1 全球总体汇总统计 x$global
查看 x$global 的汇总信息,今天日期为20220705,为最后更新日期。累计总病例为 555324897 例 其中死亡 6362663 例,设计全球国家230个,治愈165929例。
> global<-x$global
> summary(global)
Gloabl total  555324897  cases; and  6362663  deaths
Gloabl total affect country or areas: 230
Gloabl total recovered cases: 165929
last update: 2022-07-05

# 全球致死率
> global$deaths/global$cases
[1] 0.01145755
3.2 全球所有国家的最新一天数据 x$latest
查看 x$latest 的截止到最新的累计数据,打印10条数据。更新数据来自:https://www.worldometers.info/coronavirus/
> last<-x$latest
> head(last["Global"],10)
     country    cases  deaths recovered  active todayCases todayDeaths todayRecovered population      tests    updated
1    Germany 28542484  141397  26886400 1514687     147489         102         143600   84320113  122332384 2022-07-05
2      Italy 18805756  168604  17617973 1019179      36282          59          27590   60283926  227930923 2022-07-05
3     Brazil 32536302  672101  30967114  897087      33833          84          60539  215583725   63776166 2022-07-05
4  Australia  8254785   10039   7979050  265696      29661          25          17866   26092113   74123177 2022-07-05
5     France 31452173  149726  29774233 1528214      24418          97          73899   65562570  271490188 2022-07-05
6     Taiwan  3893612    7025   2996511  890076      23087          69          66067   23903044   21241708 2022-07-05
7      Japan  9398126   31316   9179820  186990      22154           8          13900  125701774   56860191 2022-07-05
8     Israel  4391284   10984   4264371  115929      19378           7              0    9326000   41373364 2022-07-05
9      India 43532788  525242  42891933  115613      14224          19          12456 1407162089  863999907 2022-07-05
10       USA 89567321 1043372  85286101 3237848      13317          38         113249  334887583 1052987802 2022-07-05
选择美国、印度、中国的汇总数据。
> last[c("USA","India","China")]
   country    cases  deaths recovered  active todayCases todayDeaths todayRecovered population      tests    updated
9    India 43532788  525242  42891933  115613      14224          19          12456 1407162089  863999907 2022-07-05
10     USA 89567321 1043372  85286101 3237848      13317          38         113249  334887583 1052987802 2022-07-05
76   China   225923    5226    220165     532         72           0             50 1439323776  160000000 2022-07-05
查看中国在2022-07-05日的明细数据。
> last$detail[which(last$detail$country=="China"),]
      updated country countryInfo._id countryInfo.iso2 countryInfo.iso3 countryInfo.lat countryInfo.long
76 2022-07-05   China             156               CN              CHN              35              105
                             countryInfo.flag  cases todayCases deaths todayDeaths recovered todayRecovered active critical
76 https://disease.sh/assets/img/flags/cn.png 225923         72   5226           0    220165             50    532        0
   casesPerOneMillion deathsPerOneMillion     tests testsPerOneMillion population continent oneCasePerPeople oneDeathPerPeople
76                157                   4 160000000             111163 1439323776      Asia             6371            275416
   oneTestPerPeople activePerOneMillion recoveredPerOneMillion criticalPerOneMillion
76                9                0.37                 152.96                     0
3.3 全球所有国家的历史数据x$historical
查看历史数据,数据源来自:https://coronavirus.jhu.edu/map.html
# 创建变量
> hist<-x$historical

# 查看中国的历史数据前10行
> head(hist["China"],10)
     country       date cases deaths recovered
39     China 2020-01-22   548     17        28
238    China 2020-01-23   643     18        30
437    China 2020-01-24   920     26        36
636    China 2020-01-25  1406     42        39
835    China 2020-01-26  2075     56        49
1034   China 2020-01-27  2877     82        58
1233   China 2020-01-28  5509    131       101
1432   China 2020-01-29  6087    133       120
1631   China 2020-01-30  8141    171       135
1830   China 2020-01-31  9802    213       214

# 查看中国的历史数据后10行
> tail(hist["China"],10)
       country       date   cases deaths recovered
176154   China 2022-06-25 2124209  14624         0
176353   China 2022-06-26 2126233  14624         0
176552   China 2022-06-27 2128225  14624         0
176751   China 2022-06-28 2130033  14625         0
176950   China 2022-06-29 2132190  14625         0
177149   China 2022-06-30 2134718  14627         0
177348   China 2022-07-01 2137169  14628         0
177547   China 2022-07-02 2139919  14631         0
177746   China 2022-07-03 2142216  14633         0
177945   China 2022-07-04 2144566  14633         0
查看中国北京的数据
> head(hist['China','beijing'])
    country province       date cases deaths recovered
6     China  beijing 2020-01-22    14      0         0
95    China  beijing 2020-01-23    22      0         0
184   China  beijing 2020-01-24    36      0         1
273   China  beijing 2020-01-25    41      0         2
362   China  beijing 2020-01-26    68      0         2
451   China  beijing 2020-01-27    80      1         2
可视化北京疫情数据情况
> library(ggplot2)
> library(reshape2)
> beijing_df<-hist['China','beijing']
> beijing<-melt(beijing_df[,c("date", "cases" ,"deaths", "recovered")],id.vars = c("date"))
>
> g<-ggplot(data = beijing, mapping = aes(x=date,y=value,colour=variable))
> g<-g+geom_line() + geom_point()                                   #绘制线图和点图
> g<-g+scale_shape_manual(values = c(21,23))                        #自定义点形状
> g<-g+scale_y_log10()
> g<-g+ggtitle("北京疫情统计")+xlab("日期")+ylab("Log(人数)")
> g

上图中,红色线为累计感染新冠人数,绿色线为累计致死人数,蓝色线为治愈人数,从2021-08-05 数据就停了,因为出现了蓝色线直接到0的情况。
3.4 目前疫苗研发进展 x$vaccine
nCov2019数据集,还收集了疫苗研发进展等相关数据,数据源来自:https://www.raps.org/news-and-articles/news-articles/2020/3/covid-19-vaccine-tracker。
用户可以检查疫苗的开发状态,使用summary() 来查看疫苗的试验阶段,和候选疫苗数量。
# 查看疫苗数据
> vac <- x$vaccine

# 尝试阶段,和候选疫苗
> summary(vac)
         phase candidates
1      Phase 3         10
2    Phase 2/3          3
3      Phase 2          2
4    Phase 1/2          9
5      Phase 1         13
6 Pre-clinical         14
查看每种疫苗的摘要信息,例如机制、试验阶段、 机构等。
> head(vac["all"])
   id candidate                                                                mechanism                 sponsors trialPhase
1 id1    BNT162                                                       mRNA-based vaccine         Pfizer, BioNTech    Phase 3
2 id2 mRNA-1273                                                       mRNA-based vaccine                  Moderna    Phase 3
3 id3  Ad5-nCoV                           Recombinant vaccine (adenovirus type 5 vector)        CanSino Biologics    Phase 3
4 id4   AZD1222 Replication-deficient viral vector vaccine (adenovirus from chimpanzees) The University of Oxford    Phase 3
5 id5 CoronaVac                        Inactivated vaccine (formalin with alum adjuvant)                  Sinovac    Phase 3
6 id6   Covaxin                                                      Inactivated vaccine           Bharat Biotech    Phase 3
                                             institutions
1 Multiple study sites in Europe, North America and China
2  Kaiser Permanente Washington Health Research Institute
3                                         Tongji Hospital
4                          The University of Oxford,
5              Sinovac Research and Development Co., Ltd.
6
在中国,我们主要使用的 科兴生物公司的疫苗。科兴控股生物技术有限公司(简称科兴生物,英语:Sinovac Biotech)是中国的生物技术和疫苗生产公司,总部设于北京市海淀区。科兴生物成立于1999年,曾在美国上市,公司通过全资子公司科兴控股(香港)有限公司,拥有北京科兴生物制品有限公司、科兴(大连)疫苗技术有限公司、北京科兴中维生物技术有限公司和北京科兴中益生物医药有限公司四家企业。
科兴2019冠状病毒病疫苗(英语:Sinovac COVID-19 Vaccine,俗称科兴疫苗,商品名克尔来福(英语:CoronaVac)是中国大陆生物制药公司科兴生物开发的2019冠状病毒病疫苗,属于灭活疫苗。2021年6月1日,世卫组织宣布将克尔来福列入“紧急使用清单”。
# 疫苗名称 CoronaVac
> vac["all"][which(vac["all"]$candidate=='CoronaVac'),]
   id candidate                                         mechanism sponsors trialPhase                               institutions
5 id5 CoronaVac Inactivated vaccine (formalin with alum adjuvant)  Sinovac    Phase 3 Sinovac Research and Development Co., Ltd.
查看id5的科兴疫苗的详细背景信息。
> vac[ID="id5"]
[1] "Background: CoronaVac (formerly PiCoVacc) is a formalin-inactivated
and alum-adjuvanted candidate vaccine. Results from animal studies showed
“partial or complete protection in macaques” exposed to SARS-CoV-2,
according to a paper published  in Science.  Study Design: A
Phase 1/2 trial of 743 healthy volunteers (18-59 years old) who received
two different dosages of the vaccine or placebo is active but not
recruiting. A Phase 1 trial of 143 participants (NCT04352608) and a Phase 2
trial of 600 participants (NCT04383574) are both active but not recruiting.
Sinovac said a Phase 3 trial in collaboration with Instituto Butantan in
Brazil is underway (NCT04456595), and the company plans to enroll around
9,000 patients in the healthcare industry. Trials also are underway in
Turkey (NCT04582344) and in Indonesia (NCT04508075).  Outcomes: Results
from the Phase 1/2 trials published in The Lancet Infectious Diseases
indicate the vaccine has good safety and immunogenicity, with
seroconversion occurring in 92.4% of participants receiving the 3 μg dose
on a 0-14 day schedule and 97.4% of individuals receiving the same dose on
a 0-28 day schedule.  Status:  Representatives from Sinovac told Reuters
that the vaccine appeared to be safe in older trial participants, and did
not cause any severe side effects. Preliminary results from the Instituto
Butantan trial announced by the company indicate CoronaVac is safe so far,
with no serious adverse events reported. The trial in Brazil was briefly
suspended due to a patient death, but the trial has since resumed."
Google翻译后:“背景:CoronaVac(前身为 PiCoVacc)是一种福尔马林灭活和明矾佐剂的候选疫苗。根据一篇论文,动物研究结果显示暴露于 SARS-CoV-2 的猕猴“部分或完全保护”发表在《科学》杂志上。研究设计:接受两种不同剂量疫苗或安慰剂的 743 名健康志愿者(18-59 岁)的 1/2 期试验处于活跃状态,但未招募。143 名参与者的 1 期试验 (NCT04352608) 600 名参与者的第二阶段试验 (NCT04383574) 均处于活跃状态,但未招募。科兴生物表示,与巴西 Instituto Butantan 合作的第三阶段试验正在进行中 (NCT04456595),该公司计划在医疗保健行业招募约 9,000 名患者. 土耳其 (NCT04582344) 和印度尼西亚 (NCT04508075) 的试验也在进行中。 结果: 发表在《柳叶刀传染病》上的 1/2 期试验结果表明,该疫苗具有良好的安全性和免疫原性,具有良好的安全性和免疫原性。 92.4% 的参与者在 0-14 天接受 3 μg 剂量,97.4% 的个体在 0-28 天接受相同剂量。状态:科兴生物的代表告诉路透社,该疫苗在年长的试验参与者中似乎是安全的,并且没有引起任何严重的副作用。该公司宣布的 Instituto Butantan 试验的初步结果表明 CoronaVac 到目前为止是安全的,没有报告严重的不良事件。由于患者死亡,巴西的试验曾短暂暂停,但此后又恢复了试验。”
3.5 目前的治疗学发展进展x$therapeutics
nCov2019包,治疗学发展进展的相关数据,数据源来自:https://aps.org/news-and-articles/news-articles/2020/3/covid-19-therapeutics-tracker。
用户可以查看药品的开发状态,使用summary() 来查看治疗的药品试验阶段和候选药品数量。
#查看治疗数据
> thera<- x$therapeutics
> summary(thera)
                                    phase candidates
1                                 Phase 3         13
2                             Phase 2/3/4          3
3                               Phase 2/3         28
4                               Phase 1/2          1
5                                 Phase 2         15
6                               Phase 3/4          2
7    No longer being studied for COVID-19          4
8                                 Various          1
9                                 Phase 1          4
10                             Phase 2b/3          2
11 No longer being developed for COVID-19          1
12                            Phase 1/2/3          1
13                              Phase 1/4          1
14                            Phase 1b/2a          1
15                                Phase 4          1
16                              Phase 2/2          1
17                               Phase 1b          4
18                              Phase 2/4          1
查看所有药品
> head(thera["All"])
   id       medicationClass                                                        tradeName       developerResearcher
1 id1             Antiviral Molnupiravir (Lagevrio, formerly known as MK-4482 and EIDD-2801) Ridgeback Biotherapeutics
2 id2   Monoclonal antibody                             Evusheld (tixagevimab and cilgavimab               AstraZeneca
3 id3   Monoclonal antibody                                  Regkirona (regdanvimab, CT-P59)                 Celltrion
4 id4 IL-6 receptor agonist                                  Actemra/RoActemra (tocilizumab)                     Roche
5 id5   Monoclonal antibody    Amubarvimab and romlusevimab (formerly BRII-196 and BRII-198)  Brii Biosciences Limited
6 id6         Anticoagulant                                             Heparin (UF and LMW)                     NHLBI
                   sponsors  trialPhase lastUpdate
1 Ridgeback Biotherapeutics     Phase 3 2020-12-10
2               AstraZeneca     Phase 3 2020-12-10
3                 Celltrion     Phase 3 2020-12-10
4                   Various     Phase 3 2020-12-10
5                     NIAID     Phase 3 2020-12-10
6      Operation Warp Speed Phase 2/3/4 2020-12-10
查看辉瑞公司开发了一种名为 Paxlovid 的 COVID-19 抗病毒治疗组合。 Paxlovid 是 nirmatrelvir(原 PF-07321332)(一种蛋白酶抑制剂,可阻断 SARS-CoV-2 中的一种酶并阻止病毒复制)和 HIV 抗病毒药物利托那韦的组合。
# 药品名称 Oral antiviral
> thera["All"][which(thera["All"]$medicationClass=='Oral antiviral'),]
     id medicationClass                tradeName                developerResearcher                           sponsors trialPhase
30 id30  Oral antiviral TEMPOL (4-Hydroxy-TEMPO) Adamis Pharmaceuticals Corporation Adamis Pharmaceuticals Corporation  Phase 2/3
   lastUpdate
30 2020-10-08
查看对本药品的背景介绍。
> thera[ID="id30"]
[1] "Background: TEMPOL is an oral antiviral drug being evaluated as a
potential at-home therapeutic for COVID-19. Researchers believe TEMPOL can
help to break up clusters of iron and sulfur cells that SARS-CoV-2 uses to
replicate. Additionally, researchers noted TEMPOL has anti-cytokine and
anti-inflammatory properties.Trial: A Phase 2/3 trial is currently
recruiting up to 248 participants to test whether TEMPOL can limit
hospitalization in patients with an early SARS-CoV-2 infection
(NCT04729595). At least 50 individuals in the study enrolled will have
comorbidities, according to the ClinicalTrials.gov listing."
Google翻译:TEMPOL 是一种口服抗病毒药物,被评估为 COVID-19 的潜在家庭治疗药物。研究人员认为,TEMPOL 可以帮助分解 SARS-CoV-2 用来复制的铁和硫细胞簇。 此外,研究人员指出 TEMPOL 具有抗细胞因子和抗炎特性。试验:2/3 期试验目前正在招募多达 248 名参与者,以测试 TEMPOL 是否可以限制早期 SARS-CoV-2 感染患者的住院治疗 (NCT04729595 ). 根据 ClinicalTrials.gov 的列表,参与研究的至少 50 人将患有合并症。”
4. 疫情数据可视化展示
nCov2109包,不仅可以让我们免费的获取新冠相关的数据,还支持一些可视化的展示,方便我们理解和使用数据。
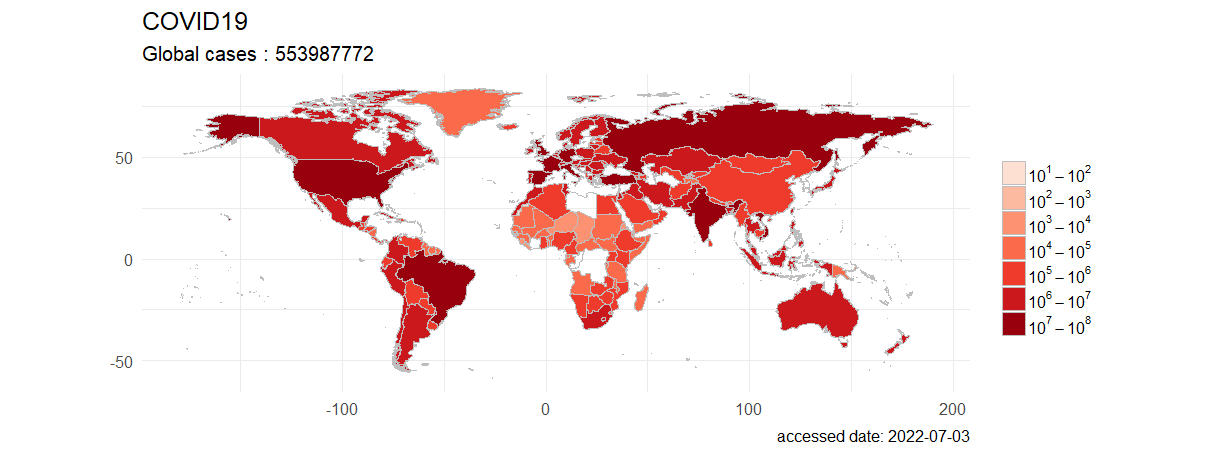
全球累计确诊病例,按国家进行可视化。
> plot(last)
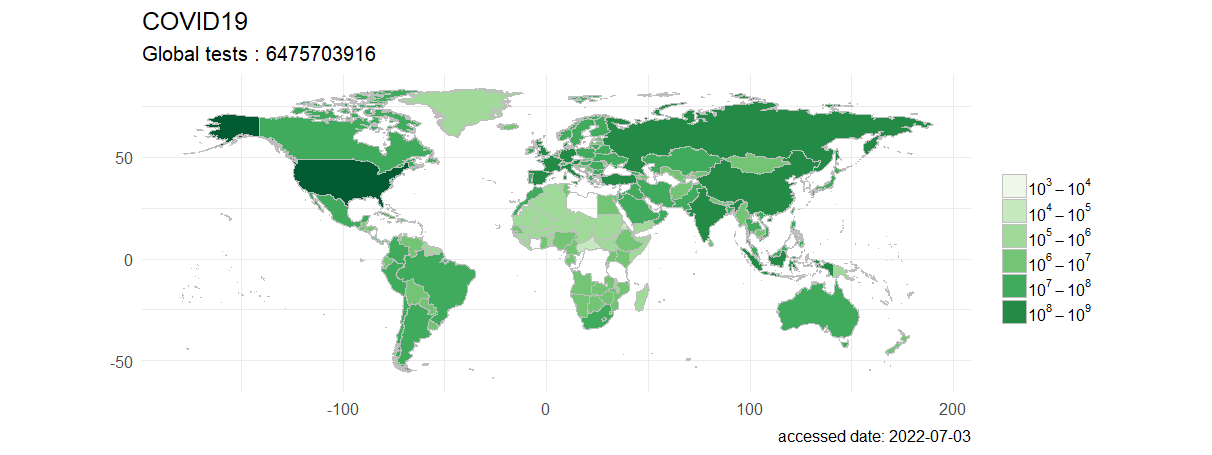
全球累计新冠检测数据,按国家进行可视化。
> plot(last, type="tests",palette="Green")
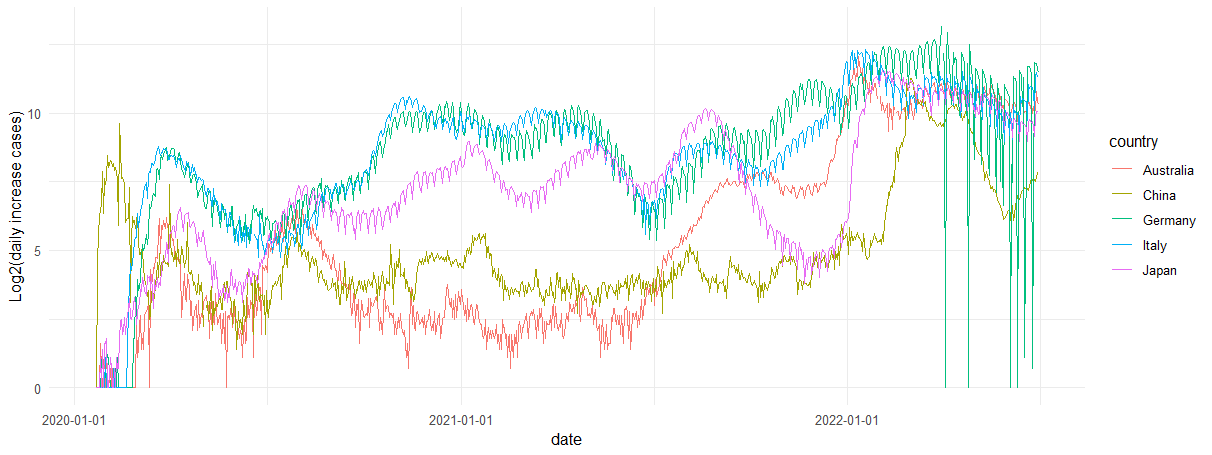
比较不同国家每天新增确诊病例的数量。
# 加载画图包
> library(ggplot2)
> library(dplyr)

# 构建数据
> tmp <- hist["global"] %>%
+   group_by(country) %>%
+   arrange(country,date) %>%
+   mutate(diff = cases - lag(cases, default =  first(cases))) %>%
+   filter(country %in% c("Australia", "Japan", "Italy", "Germany",  "China"))

# 画图
> ggplot(tmp,aes(date, log(diff+1), color=country)) + geom_line() +
+   labs(y="Log2(daily increase cases)") +
+   theme(axis.text = element_text(angle = 15, hjust = 1)) +
+   scale_x_date(date_labels = "%Y-%m-%d") +
+   theme_minimal()
指定日期,用历史数据绘制过去时间的爆发图。
> plot(hist, region="Global" ,date = "2020-08-01", type="cases")

动画效果图:画从出2022-03-01 到 2022-05-01 的数据,输出为 GIF 动画。
> from = "2020-03-01"
> to = "2020-04-01"
> plot(hist, from = from, to=to)
5. 疫情可视化:多种分析图表
nCov2019包,同时提供了其他维度的可视化分析功能。
中国累计确诊可视化。
> china <- hist['China']
> china <- china[order(china$cases), ]
> ggplot(china,
+        aes(date, cases)) +
+   geom_col(fill = 'firebrick') +
+   theme_minimal(base_size = 14) +
+   xlab(NULL) + ylab(NULL) +
+   scale_x_date(date_labels = "%Y/%m/%d") +
+   labs(caption = paste("accessed date:", max(china$date)))
画图展示8个国家的新冠确珍人数每日增速,并进行线性拟合。
> library(dplyr)
> library(magrittr)
> library(ggrepel)

# 指定国家
> country_list =  c("Italy","Brazil","Japan","China","USA","Mexico","Russia","India","Thailand")

# 数据处理
> hist[country_list]  %>%
+     subset( date > as.Date("2020-10-01") ) %>%
+     group_by(country) %>%
+     arrange(country,date) %>%
+     mutate(increase = cases - lag(cases, default =  first(cases))) -> df

# 画图
> ggplot(df, aes(x=date, y=increase, color=country  ))+
+     geom_smooth() +
+     geom_label_repel(aes(label = paste(country,increase)),
+                      data = df[df$date == max(df$date), ], hjust = 1) +
+     labs(x=NULL,y=NULL)+
+     theme_bw() + theme(legend.position = 'none')
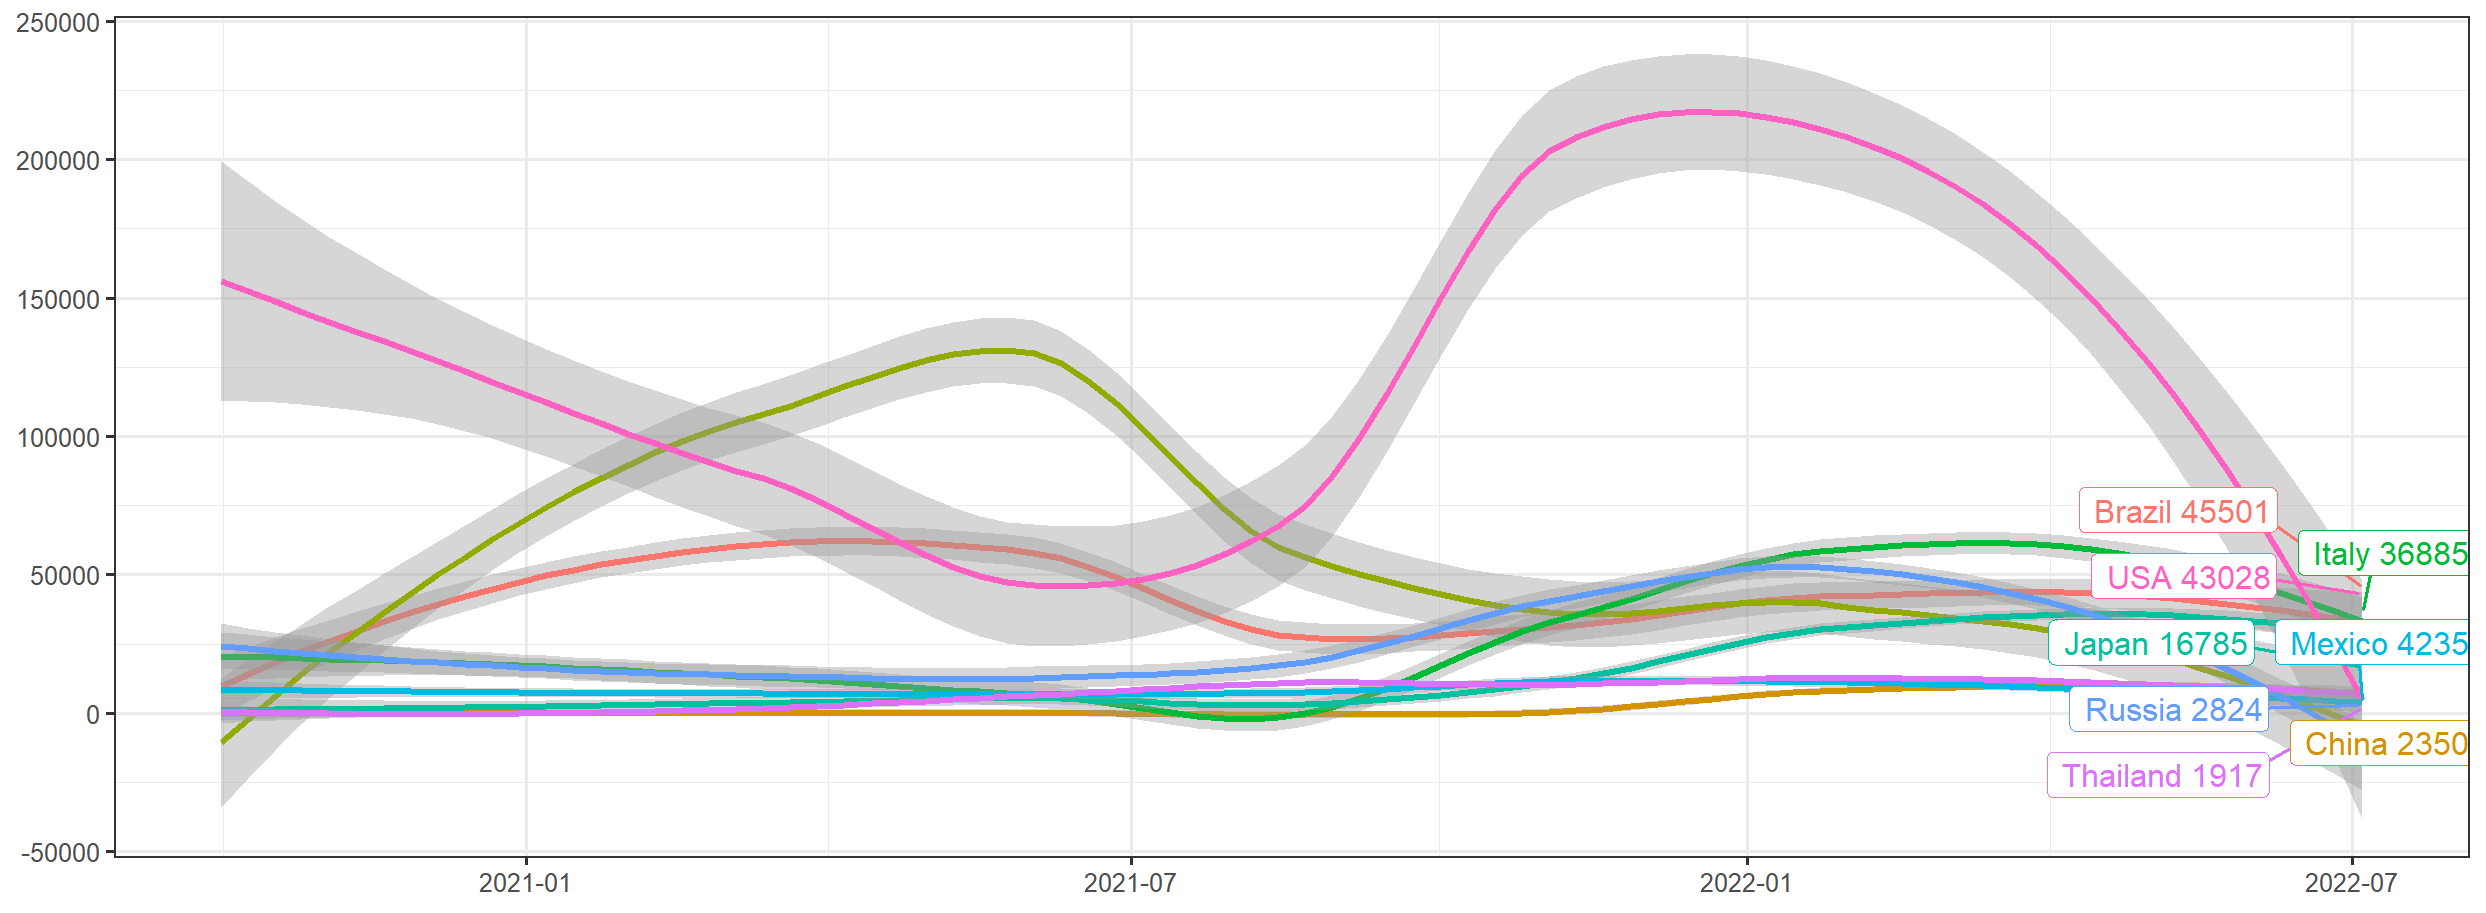
从图中可以直观看到,截止到2022年7月,当前选中的8个国家,阳性病例每日确诊都已经过了高速增长阶段,增速已明显下降。
画出印度新冠确诊和治愈的趋势。
> library('tidyr')
> country<-"India"
> india<-hist[country]
> india <- gather(india, curve, count, -date, -country)
>
> ggplot(india, aes(date, count, color = curve)) + geom_point() + geom_line() +
+   labs(x=NULL,y=NULL,title=paste("Trend of cases, recovered and deaths in", country)) +
+   scale_color_manual(values=c("#f39c12", "#dd4b39", "#00a65a")) +
+   theme_bw() +
+   geom_label_repel(aes(label = paste(curve,count)),
+                    data = india[india$date == max(india$date), ], hjust = 1) +
+   theme(legend.position = "none", axis.text = element_text(angle = 15, hjust = 1)) +
+   scale_x_date(date_labels = "%Y-%m-%d")
通过热力图画出,199个国家,新冠确诊病例影响程度。
> all <- hist["global"]
> all <- all[all$cases > 0,]
> length(unique(all$country))
[1] 199

> all <- subset(all,date <= as.Date("2020-3-19"))
> max_time <- max(all$date)
> min_time <- max_time - 7
> all <-  all[all$date >= min_time,]
> all2 <- all[all$date == max(all$date,na.rm = TRUE),]

> all$country <- factor(all$country, levels=unique(all2$country[order(all2$cases)]))
> breaks = c(0,1000, 10000, 100000, 10000000)

> ggplot(all, aes(date, country)) +
+   geom_tile(aes(fill = cases), color = 'black') +
+   scale_fill_viridis_c(trans = 'log', breaks = breaks, labels = breaks) +
+   xlab(NULL) + ylab(NULL) +
+   scale_x_date(date_labels = "%Y-%m-%d") + theme_minimal()
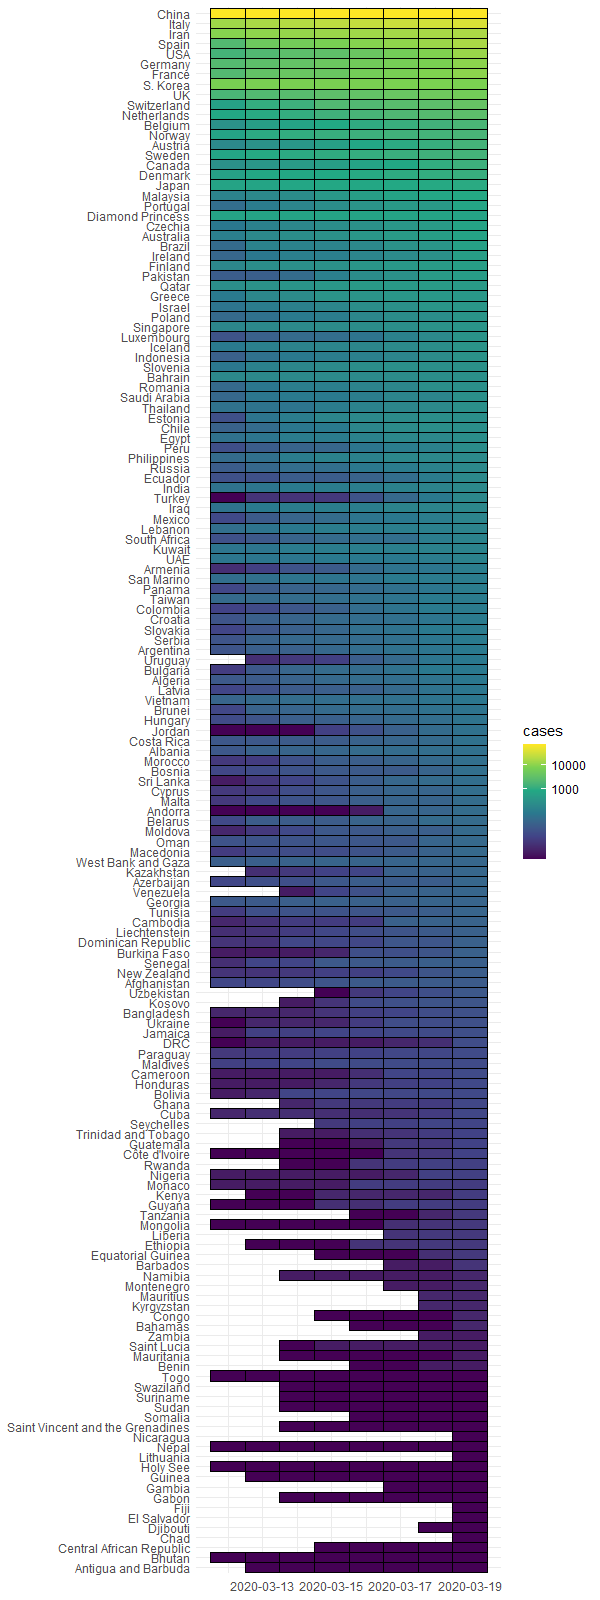
从图中对比来看,中国是防疫最高的国家。
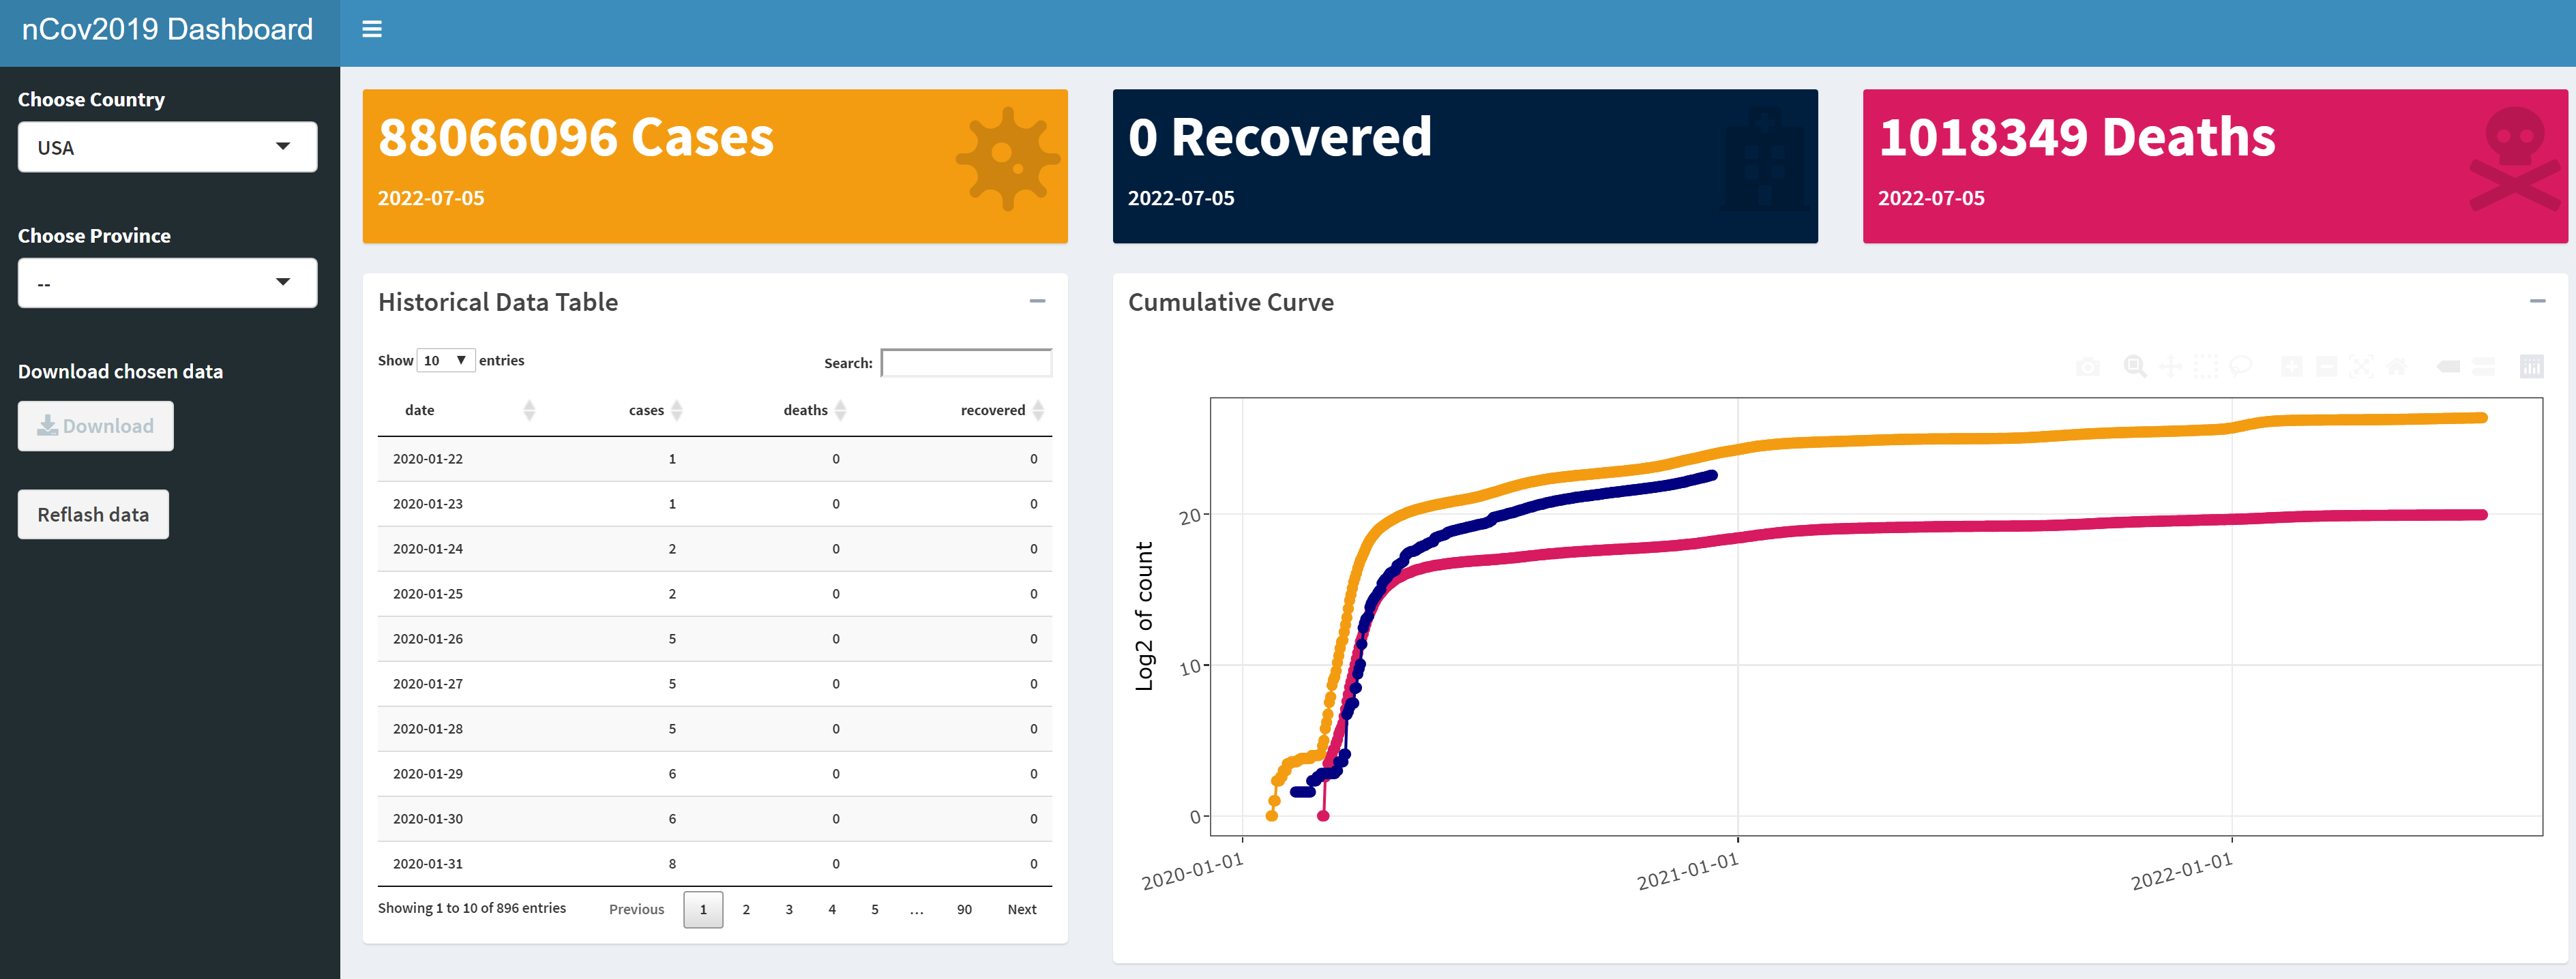
6. 疫情可视化:shiny控制台
nCov2019包,还提供了shiny的dashboard功能,面向最终使用者,生成动态可交互的效果,可以直接用于功能演示,体现R语言的强大的原型功能。
# 打开shiny 控制台
> dashboard()
本文详细地介绍了nCov2019包的使用,我们可以通过nCov2019包来方便地获取全球的新冠的数据,并且可以按国家按地区按时间,进行不同数据维度的提取。同时nCov2019包,还提供了可视化分析和可视化的shiny控制台,能帮助用户直观的理解数据,而不需要写大量程序。
文本完整的代码,已经上传github,可以自由下载使用:https://github.com/bsspirit/infect/blob/main/code/getdata.r
转载请注明出处:
http://blog.fens.me/r-coivd19-data-nCov2019